2023 Global Compensation Survey

2,000+ Members / 1,000+ Firms

Compensation CalculatorCompensation Calculator

About This Survey

In its 7th rendition, the VC Platform Global Community surveyed 775+ individuals for the 2023 VC Platform Global Compensation Survey to better understand compensation, benefits, industry trends, and emerging practices across global venture firms. The survey responses encompass “platform” focused roles. While most roles within this realm can be segmented by area of focus, title, and functional responsibilities, it is important to note that all firms are unique and operate independently.

Through a partnership with Sequoia’s Total Rewards team, VC Platform has to the best of its ability normalized survey responses based on geography, tenure, fund size, fund type, functional role, and various compensation elements. The findings in this report may not align with the standards and practices of every firm. Through the normalization process, VC Platform and Sequoia worked hard to ensure the data and visualizations are meaningful and insightful. This required an intense data-cleaning process, including but not limited to identifying and removing duplicate responses, removing the responses of those that were identified as primarily investment-focused roles, converting global currencies, selectively removing significant outliers within the data set, standardizing geographic locations, removing incomplete responses, and accounting for unique/fill-in-the-blank responses.

Thank You to Our Partner

We are delighted to work with our community sponsor Sequoia to bring this project to life. Sequoia is a pioneer in total people investment. They help companies master the practice of driving outcomes that matter through their people-focused work on compensation, benefits, wellbeing, HR and payroll, and business protection.

  • Zack RokosDirector, Compensation Advisory
  • Joe LaSorteVice President, Global Benefits
  • Lonnie AbayaCompensation Advisory Consultant
  • Sam SpiegelmanClient Service Manager, Compensation Advisory

We’d Like to Recognize the Following:

Cory BolotskyBoard Director, VC Platform
Erica AmatoriVP of Platform, Left Lane Capital & Board Director, VC Platform
Joshua GoodfieldExecutive Director, VC Platform

Individuals From 1,000+ Firms Were Invited to Participate

Representative logos include:

This Report Includes Data From...

705

Respondents

From...

2,000+

VC Platform Community Members

Who Took the Survey?

Respondents

Year-over-year survey participation

Gender Identity

Gender identity breakdown of who responded

25
1
75
Titles

What title best matches your own?

  • 12%Analyst/Associate (86)
    3-6 Years of Experience
  • 29%Manager/Sr. Associate (207)
    6-10 Years of Experience
  • 29%Director (201)
    8-14 Years of Experience
  • 16%Vice President/Sr. Vice President (110)
    12-18 Years of Experience
  • 14%Partner/CxO (101)
    15-25 Years of Experience
Primary Role

Count of what is the primary focus of your role

  • 32%Community & Portfolio Support (226)
  • 15%Talent & Recruiting (106)
  • 22%Marketing, Content , & Events (156)
  • 11%Business Development & Partnership (77)
  • 13%Internal Operations (92)
  • 5%Investor Relations / Fundraising (36)
  • 2%Other (12)

Respondents Firm Information

Firm Assets Under Management
  • 119 (17%)Less Than $100M USD
  • 117 (17%)$100M - $249M USD
  • 82 (12%)$250M- $499M USD
  • 98 (14%)$500M - $999M USD
  • 148 (21%)$1.0Bn - $2.49Bn USD
  • 55 (8%)$2.5Bn - $4.9Bn USD
  • 77 (10%)More than $5.0Bn USD
  • 9 (1%)Other
Fund Type
  • 563 (80%)Venture Capital Firm
  • 45 (6%)Corporate Venture Capital Firm
  • 74 (10%)Growth/Private Equity
  • 23 (4%)Other
Investment Stage
  • 34 (5%)Pre-Seed
  • 415 (59%)Early Stage: Seed → Series B
  • 36 (5%)Growth Stage: Series B → Series D
  • 213 (30%)Multi Stage
  • 7 (1%)Other

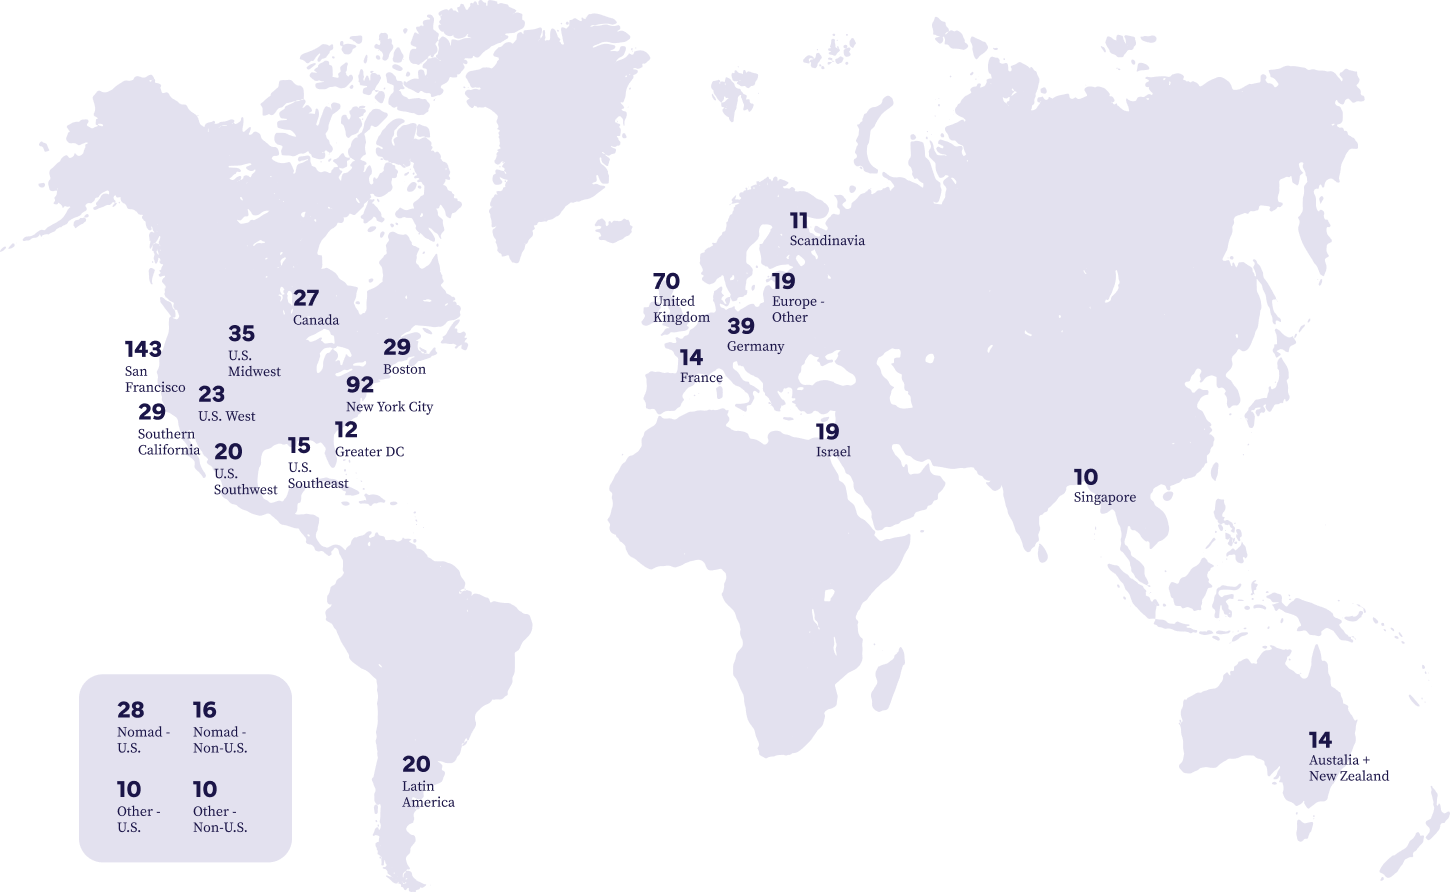
Respondents Geography

+9%

YoY increase in US respondents

+38%

YoY increase in European respondents

+30%

YoY increase for across all other regions' respondents
Primary Filters
Secondary Filters
Display Currency
https://compsurvey.vcplatform.com/wp-content/uploads/2022/11/logo.svg
Filters Selected
  • United States
  • Manager
  • Years of Exp: 14-25+
Clear
Current Dataset Profile

--

Survey Participants

--

Avg Total Years of Prof Experience

Firm AUM Breakdown
  • 8 (35%)Business Development
  • 8 (15%)Business Development
  • 8 (25%)Business Development
  • 8 (25%)Business Development
  • 8 (25%)Business Development
  • 8 (25%)Business Development
Cash Compensation
  Market Data Percentiles
10th 25th 50th 75th 90th  
Base Salary -- -- -- -- --  
Bonus -- -- -- -- --  
Total Cash -- -- -- -- --  
             
Cash Compensation
  Market Data Percentiles
25th 50th 75th  
Base Salary -- -- --  
Bonus -- -- --  
Total Cash -- -- --  
         
Carry Eligibility
  • 8 (35%)Business Development
  • 8 (15%)Business Development
  • 8 (25%)Business Development
Carry
  Market Data Percentiles
10th 25th 50th 75th 90th  
Total Dollars at Work -- -- -- -- --  
Max Fund Dollars at Work -- -- -- -- --  
Carry % (Max if Mult. Funds) -- -- -- -- --  
             
Carry
  Market Data Percentiles
25th 50th 75th  
Total Dollars at Work -- -- --  
Max Fund Dollars at Work -- -- --  
Carry % (Max if Mult. Funds) -- -- --  
         

How does compensation vary between functions?

"This will depend on how your own firm manages compensation. For example, some firms will manage all associate level salaries within the Platform organization in one range, regardless of specialty. You are most likely to see this at large firms. Others will breakout salary ranges by both level and specialty, and sometimes by each individual job. The net result is you do see differences in pay by specialty when you look at the overall market, but your firm may not actually administer pay in this way."
Sam SpiegelmanClient Service Manager, Compensation Advisory

Bonus Compensation

Bonus as a Percentage of Base Salary

74.1%

Of Respondents Receive a Bonus

74.1%

Of Respondents Receive a Bonus

74.1%

Of Respondents Receive a Bonus

74.1%

Of Respondents Receive a Bonus

74.1%

Of Respondents Receive a Bonus

74.1%

Of Respondents Receive a Bonus

  • 27%0-10% of base compensation
  • 34%10-20% of base compensation
  • 19%20-30% of base compensation
  • 7%30-40% of base compensation
  • 6%40-50% of base compensation
  • 7%50%+ of base compensation
  • 57%0-10% of base compensation
  • 20%10-20% of base compensation
  • 10%20-30% of base compensation
  • 0%30-40% of base compensation
  • 5%40-50% of base compensation
  • 8%50%+ of base compensation
How is Your Bonus Payout Determined?
69
31
  • 31%0-10% of base compensation
  • 37%10-20% of base compensation
  • 16%20-30% of base compensation
  • 9%30-40% of base compensation
  • 4%40-50% of base compensation
  • 3%50%+ of base compensation
How is Your Bonus Payout Determined?
76
24
  • 28%0-10% of base compensation
  • 38%10-20% of base compensation
  • 19%20-30% of base compensation
  • 5%30-40% of base compensation
  • 5%40-50% of base compensation
  • 5%50%+ of base compensation
How is Your Bonus Payout Determined?
79
21
  • 17%0-10% of base compensation
  • 33%10-20% of base compensation
  • 21%20-30% of base compensation
  • 9%30-40% of base compensation
  • 13%40-50% of base compensation
  • 7%50%+ of base compensation
How is Your Bonus Payout Determined?
83
17
  • 7%0-10% of base compensation
  • 29%10-20% of base compensation
  • 29%20-30% of base compensation
  • 11%30-40% of base compensation
  • 5%40-50% of base compensation
  • 19%50%+ of base compensation
How is Your Bonus Payout Determined?
77
23

How are bonus payments trending?

"Bonuses across all industries are not quite what they used to be largely due to the macroeconomic headwinds we all know well. Whereas in prior years bonuses were consistently paid out at or above target for those that received one, this year bonuses have been paid out at 80% of target on average. Furthermore, of those that were eligible for a bonus, roughly 30% of those employees did not receive a bonus."
Zack RokosDirector, Compensation Advisory

Carry Questions

When you INITIALLY joined your firm, what fund(s) were you awarded carry in?
  • 13%I was awarded carry in the TWO most recently raised active funds at my firm upon joining (49)


  • 19%I was not awarded carry in any funds at my firm upon joining (72)


  • 51%I was awarded carry in the ONE most recently raised active fund at my firm upon joining (190)

  • 13%I was awarded carry in ALL active funds at my firm upon joining, including historic funds (47)
  • 2%Other (7)

  • 2%N/A - when I joined my firm they had not yet raised any funds (9)
Do you contribute capital towards your portion of carried interest?
  • 76%No (286)


  • 5%Yes, using pre-tax income (19)

  • 13%Yes, using after-tax income (50)

  • 6%Yes, but using a loan from my fund (22)

Carry Vesting Practices

Vesting Method
  • 46%Straight-line/linear vesting with a cliff (149)
  • 27%Straight-line/linear vesting with no cliff (86)
  • 11%Other (non-linear vesting)
    (36)

  • 16%I’m not sure
    (50)


Cliff Vesting Practices
  • 8%N/A - No Cliff (16)
  • 65%12 Months (125)
  • 3%18 Months (5)
  • 15%24 Months (29)
  • 4%36 Months (8)
  • 5%Other
    (10)
Vesting Schedule
4
9
16
16
15
9
21
10
Vesting Method VS. Length
 Straight LineNon-Linear
1-3 Years31 (97%)1 (3%) 
4 Years56 (97%)2 (3%) 
5 Years54 (93%)4 (7%) 
6-7 Years56 (98%) 1 (2%) 
8-9 Years31 (89%)4 (11%) 
10 Years56 (73%) 21 (27%) 
       

How does carry allocation adjust with firm growth?

"Carry is complex in and of itself and is further complicated by the fact that each program is unique. If you are confused about how your carry program works, the best thing you can do is ask your finance team. You can also leverage the Carry Calculator to estimate the potential value of your carry as well as the survey to understand how your opportunity compares to market"
Zack RokosDirector, Compensation Advisory

Global Benefits

Physical Wellbeing
Healthcare Coverage or Stipend
65%
455 out of 705
Meal Stipend
26%
180 out of 705
Gym or physical wellness Stipend
26%
184 out of 705
Emotional Wellbeing
Mental wellbeing support or stipend
24%
169 out of 705
Professional development stipend
25%
174 out of 705
Professional coach
11%
78 out of 705
Financial Wellbeing
Retirement account (401k/IRA) funding or match
54%
378 out of 705
Transit benefits
21%
150 out of 705
Work from home stipend
18%
130 out of 705
Educational, tuition, or continued education stipend
15%
103 out of 705
Student loan matching
2%
14 out of 705
N/A
No compensation other than salary and bonus
12%
87 out of 705
0%
25%
50%
75%
100%
Physical Wellbeing
Healthcare Coverage or Stipend
74%
321 out of 436
Meal Stipend
25%
111 out of 436
Gym or physical wellness Stipend
27%
116 out of 436
Emotional Wellbeing
Mental wellbeing support or stipend
24%
103 out of 436
Professional development stipend
25%
109 out of 436
Professional coach
11%
46 out of 436
Financial Wellbeing
Retirement account (401k/IRA) funding or match
72%
313 out of 436
Transit benefits
25%
111 out of 436
Work from home stipend
18%
80 out of 436
Educational, tuition, or continued education stipend
14%
61 out of 436
Student loan matching
3%
12 out of 436
N/A
No compensation other than salary and bonus
8%
37 out of 436
0%
25%
50%
75%
100%
Physical Wellbeing
Healthcare Coverage or Stipend
62%
82 out of 133
Meal Stipend
28%
37 out of 133
Gym or physical wellness Stipend
32%
42 out of 133
Emotional Wellbeing
Mental wellbeing support or stipend
29%
38 out of 133
Professional development stipend
32%
43 out of 133
Professional coach
15%
20 out of 133
Financial Wellbeing
Retirement account (401k/IRA) funding or match
34%
45 out of 133
Transit benefits
14%
19 out of 133
Work from home stipend
20%
26 out of 133
Educational, tuition, or continued education stipend
15%
20 out of 133
Student loan matching
1%
1 out of 133
N/A
No compensation other than salary and bonus
23%
31 out of 133
0%
25%
50%
75%
100%
Physical Wellbeing
Healthcare Coverage or Stipend
71%
20 out of 28
Meal Stipend
4%
1 out of 28
Gym or physical wellness Stipend
32%
9 out of 28
Emotional Wellbeing
Mental wellbeing support or stipend
50%
14 out of 28
Professional development stipend
21%
6 out of 28
Professional coach
18%
5 out of 28
Financial Wellbeing
Retirement account (401k/IRA) funding or match
21%
6 out of 28
Transit benefits
4%
1 out of 28
Work from home stipend
39%
11 out of 28
Educational, tuition, or continued education stipend
29%
8 out of 28
Student loan matching
0 out of 28
N/A
No compensation other than salary and bonus
14%
4 out of 28
0%
25%
50%
75%
100%
Physical Wellbeing
Healthcare Coverage or Stipend
70%
54 out of 77
Meal Stipend
16%
12 out of 77
Gym or physical wellness Stipend
22%
17 out of 77
Emotional Wellbeing
Mental wellbeing support or stipend
35%
27 out of 77
Professional development stipend
23%
18 out of 77
Professional coach
13%
10 out of 77
Financial Wellbeing
Retirement account (401k/IRA) funding or match
40%
31 out of 77
Transit benefits
4%
3 out of 77
Work from home stipend
19%
15 out of 77
Educational, tuition, or continued education stipend
13%
10 out of 77
Student loan matching
1%
1 out of 77
N/A
No compensation other than salary and bonus
10%
8 out of 77
0%
25%
50%
75%
100%
Physical Wellbeing
Healthcare Coverage or Stipend
13%
2 out of 15
Meal Stipend
13%
2 out of 15
Gym or physical wellness Stipend
33%
5 out of 15
Emotional Wellbeing
Mental wellbeing support or stipend
40%
6 out of 15
Professional development stipend
33%
5 out of 15
Professional coach
0 out of 15
Financial Wellbeing
Retirement account (401k/IRA) funding or match
40%
6 out of 15
Transit benefits
7%
1 out of 15
Work from home stipend
13%
2 out of 15
Educational, tuition, or continued education stipend
40%
6 out of 15
Student loan matching
7%
1 out of 15
N/A
No compensation other than salary and bonus
20%
3 out of 15
0%
25%
50%
75%
100%
Physical Wellbeing
Healthcare Coverage or Stipend
80%
8 out of 10
Meal Stipend
20%
2 out of 10
Gym or physical wellness Stipend
20%
2 out of 10
Emotional Wellbeing
Mental wellbeing support or stipend
20%
2 out of 10
Professional development stipend
20%
2 out of 10
Professional coach
10%
1 out of 10
Financial Wellbeing
Retirement account (401k/IRA) funding or match
10%
1 out of 10
Transit benefits
0 out of 10
Work from home stipend
20%
2 out of 10
Educational, tuition, or continued education stipend
0 out of 10
Student loan matching
0 out of 10
N/A
No compensation other than salary and bonus
20%
2 out of 10
0%
25%
50%
75%
100%
Physical Wellbeing
Healthcare Coverage or Stipend
13%
5 out of 40
Meal Stipend
13%
5 out of 40
Gym or physical wellness Stipend
33%
13 out of 40
Emotional Wellbeing
Mental wellbeing support or stipend
15%
6 out of 40
Professional development stipend
25%
10 out of 40
Professional coach
15%
6 out of 40
Financial Wellbeing
Retirement account (401k/IRA) funding or match
13%
5 out of 40
Transit benefits
15%
6 out of 40
Work from home stipend
10%
4 out of 40
Educational, tuition, or continued education stipend
8%
3 out of 40
Student loan matching
0 out of 40
N/A
No compensation other than salary and bonus
38%
15 out of 40
0%
25%
50%
75%
100%
Physical Wellbeing
Healthcare Coverage or Stipend
60%
12 out of 20
Meal Stipend
50%
10 out of 20
Gym or physical wellness Stipend
25%
5 out of 20
Emotional Wellbeing
Mental wellbeing support or stipend
15%
3 out of 20
Professional development stipend
25%
5 out of 20
Professional coach
15%
3 out of 20
Financial Wellbeing
Retirement account (401k/IRA) funding or match
0 out of 20
Transit benefits
40%
8 out of 20
Work from home stipend
35%
7 out of 20
Educational, tuition, or continued education stipend
30%
6 out of 20
Student loan matching
0 out of 20
N/A
No compensation other than salary and bonus
15%
3 out of 20
0%
25%
50%
75%
100%
Physical Wellbeing
Healthcare Coverage or Stipend
73%
11 out of 15
Meal Stipend
73%
11 out of 15
Gym or physical wellness Stipend
33%
5 out of 15
Emotional Wellbeing
Mental wellbeing support or stipend
0 out of 15
Professional development stipend
27%
4 out of 15
Professional coach
7%
1 out of 15
Financial Wellbeing
Retirement account (401k/IRA) funding or match
27%
4 out of 15
Transit benefits
40%
6 out of 15
Work from home stipend
0 out of 15
Educational, tuition, or continued education stipend
13%
2 out of 15
Student loan matching
0 out of 15
N/A
No compensation other than salary and bonus
0 out of 15
0%
25%
50%
75%
100%
Physical Wellbeing
Healthcare Coverage or Stipend
67%
8 out of 12
Meal Stipend
42%
5 out of 12
Gym or physical wellness Stipend
42%
5 out of 12
Emotional Wellbeing
Mental wellbeing support or stipend
33%
4 out of 12
Professional development stipend
50%
6 out of 12
Professional coach
25%
3 out of 12
Financial Wellbeing
Retirement account (401k/IRA) funding or match
33%
4 out of 12
Transit benefits
25%
3 out of 12
Work from home stipend
33%
4 out of 12
Educational, tuition, or continued education stipend
8%
1 out of 12
Student loan matching
0 out of 12
N/A
No compensation other than salary and bonus
8%
1 out of 12
0%
25%
50%
75%
100%
Physical Wellbeing
Healthcare Coverage or Stipend
21%
4 out of 19
Meal Stipend
79%
15 out of 19
Gym or physical wellness Stipend
5%
1 out of 19
Emotional Wellbeing
Mental wellbeing support or stipend
0 out of 19
Professional development stipend
5%
1 out of 19
Professional coach
5%
1 out of 19
Financial Wellbeing
Retirement account (401k/IRA) funding or match
32%
6 out of 19
Transit benefits
53%
10 out of 19
Work from home stipend
11%
2 out of 19
Educational, tuition, or continued education stipend
0 out of 19
Student loan matching
0 out of 19
N/A
No compensation other than salary and bonus
16%
3 out of 19
0%
25%
50%
75%
100%
Physical Wellbeing
Healthcare Coverage or Stipend
20%
4 out of 20
Meal Stipend
20%
4 out of 20
Gym or physical wellness Stipend
10%
2 out of 20
Emotional Wellbeing
Mental wellbeing support or stipend
5%
1 out of 20
Professional development stipend
25%
5 out of 20
Professional coach
0 out of 20
Financial Wellbeing
Retirement account (401k/IRA) funding or match
5%
1 out of 20
Transit benefits
5%
1 out of 20
Work from home stipend
15%
3 out of 20
Educational, tuition, or continued education stipend
20%
4 out of 20
Student loan matching
0 out of 20
N/A
No compensation other than salary and bonus
35%
7 out of 20
0%
25%
50%
75%
100%
Physical Wellbeing
Healthcare Coverage or Stipend
46%
6 out of 13
Meal Stipend
15%
2 out of 13
Gym or physical wellness Stipend
31%
4 out of 13
Emotional Wellbeing
Mental wellbeing support or stipend
23%
3 out of 13
Professional development stipend
23%
3 out of 13
Professional coach
15%
2 out of 13
Financial Wellbeing
Retirement account (401k/IRA) funding or match
8%
1 out of 13
Transit benefits
0 out of 13
Work from home stipend
0 out of 13
Educational, tuition, or continued education stipend
15%
2 out of 13
Student loan matching
0 out of 9
N/A
No compensation other than salary and bonus
31%
4 out of 13
0%
25%
50%
75%
100%

How are benefits offerings changing for employees?

"As employers look to move past the economic constraints of the last few years, many are reactivating postponed plans for global expansion and investing more in countries where they already operate. Benefits play an important role in this, especially in terms of attracting, motivating, and retaining key talent to support this expansion. Controlling costs is still a key concern, but achieving strategic consistency in benefit provision across country borders while maintaining local compliance and local market competitiveness is increasingly important. Wellbeing benefits continue to grow in popularity in the roster of benefits provided by global companies. There’s also more focus on implementing globally consistent approaches to benefits administration, particularly with respect to areas impacting the employee experience such as plan enrollment, communication, and personalized employee support."
Joe LaSorteVice President, Global Benefits

Remote Work

How many days do you work in your office?

United States
  • 33%Fully Remote
    (145)
  • 48%1-3 days per week in the office (211)
  • 19%4 - 5 days per week in the office (80)
Europe
  • 19%Fully remote
    (32)
  • 45%1- 3 days per week in the office (73)
  • 36%4 - 5 days per week in the office (59)

Parental Leave

Does your firm have a parental leave policy?
66
6
28
If Yes, Does It Cover Both Parents or Primary Caregiver?
84
16
How Long Does the Primary Caregiver Receive Full Salary?
  • 9%1 Month
    (24)
  • 6%2 Months
    (16)
  • 39%3 Months
    (105)
  • 25%4 Months
    (67)
  • 7%5 Months
    (19)
  • 14%6+ Months
    (38)
How Long Does the Secondary Caregiver Receive Full Salary?
  • 43%1 Month (75)
  • 14%2 Months (24)
  • 18%3 Months (31)
  • 16%4 Months (27)
  • 2%5 Months (4)
  • 7%6+ Months (13)
Does your firm have a parental leave policy?
69
4
27
If Yes, Does It Cover Both Parents or Primary Caregiver?
88
12
How Long Does the Primary Caregiver Receive Full Salary?
  • 9%1 Month
    (16)
  • 8%2 Months
    (14)
  • 45%3 Months
    (80)
  • 28%4 Months
    (50)
  • 4%5 Months
    (8)
  • 6%6+ Months
    (10)
How Long Does the Secondary Caregiver Receive Full Salary?
  • 46%1 Month (56)
  • 11%2 Months (14)
  • 24%3 Months (29)
  • 16%4 Months (19)
  • 2%5 Months (2)
  • 2%6+ Months (2)
Does your firm have a parental leave policy?
59
10
32
If Yes, Does It Cover Both Parents or Primary Caregiver?
82
18
How Long Does the Primary Caregiver Receive Full Salary?
  • 10%1 Month
    (5)
  • 2%2 Months
    (1)
  • 18%3 Months
    (9)
  • 20%4 Months
    (10)
  • 8%5 Months
    (4)
  • 42%6+ Months
    (21)
How Long Does the Secondary Caregiver Receive Full Salary?
  • 40%1 Month (12)
  • 10%2 Months (3)
  • 3%3 Months (1)
  • 17%4 Months (5)
  • 0%5 Months (0)
  • 30%6+ Months (9)
Does your firm have a parental leave policy?
75
7
18
If Yes, Does It Cover Both Parents or Primary Caregiver?
90
10
How Long Does the Primary Caregiver Receive Full Salary?
  • 0%1 Month
    (0)
  • 0%2 Months
    (0)
  • 27%3 Months
    (3)
  • 0%4 Months
    (0)
  • 64%5 Months
    (7)
  • 9%6+ Months
    (1)
How Long Does the Secondary Caregiver Receive Full Salary?
  • 0%1 Month (0)
  • 78%2 Months (7)
  • 11%3 Months (1)
  • 0%4 Months (0)
  • 0%5 Months (0)
  • 11%6+ Months (1)
Does your firm have a parental leave policy?
65
10
25
If Yes, Does It Cover Both Parents or Primary Caregiver?
84
16
How Long Does the Primary Caregiver Receive Full Salary?
  • 10%1 Month
    (3)
  • 3%2 Months
    (1)
  • 17%3 Months
    (5)
  • 13%4 Months
    (4)
  • 10%5 Months
    (3)
  • 47%6+ Months
    (14)
How Long Does the Secondary Caregiver Receive Full Salary?
  • 45%1 Month (9)
  • 10%2 Months (2)
  • 5%3 Months (1)
  • 10%4 Months (2)
  • 0%5 Months (0)
  • 30%6+ Months (6)
Does your firm have a parental leave policy?
93
0
7
If Yes, Does It Cover Both Parents or Primary Caregiver?
93
7
Does your firm have a parental leave policy?
60
0
40
If Yes, Does It Cover Both Parents or Primary Caregiver?
50
50
Does your firm have a parental leave policy?
48
8
44
If Yes, Does It Cover Both Parents or Primary Caregiver?
88
13
Does your firm have a parental leave policy?
70
5
25
If Yes, Does It Cover Both Parents or Primary Caregiver?
50
50
Does your firm have a parental leave policy?
53
7
40
If Yes, Does It Cover Both Parents or Primary Caregiver?
63
37
Does your firm have a parental leave policy?
92
8
0
If Yes, Does It Cover Both Parents or Primary Caregiver?
82
18
Does your firm have a parental leave policy?
47
6
47
If Yes, Does It Cover Both Parents or Primary Caregiver?
43
57
Does your firm have a parental leave policy?
40
15
45
If Yes, Does It Cover Both Parents or Primary Caregiver?
71
29
Does your firm have a parental leave policy?
54
15
31
If Yes, Does It Cover Both Parents or Primary Caregiver?
67
33